
Amazon BSR History Chrome Extension – BSR, Offers, Price & Reviews
Amazon only shows a product’s current Best Sellers Rank. ProductPanel adds up to 12 months of BSR history plus offer count, price and review history charts to every Amazon product page, so you can see how often a product sells and how the competition changes over time.
What is Amazon BSR?
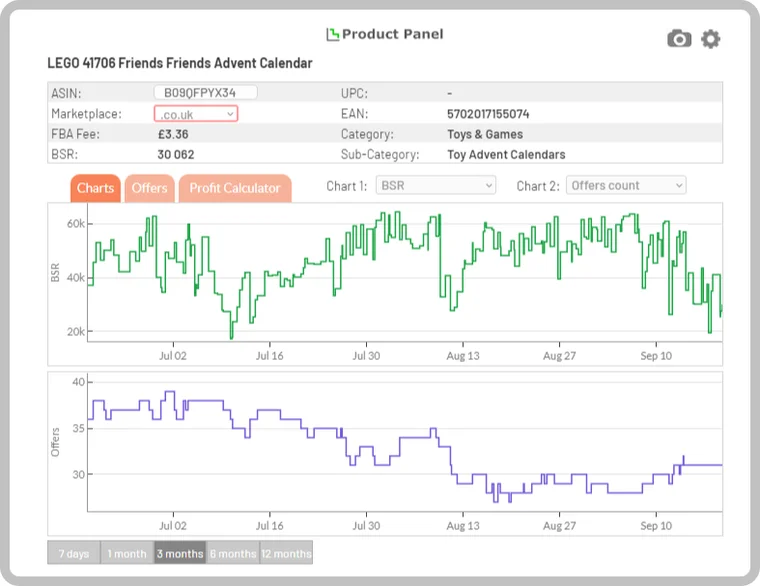
Best Sellers Rank (BSR) is a number Amazon gives a product based on its recent sales compared with every other product in the same category. #1 is the best seller. The lower the BSR, the more the product sells. Amazon recalculates it frequently, so a single snapshot tells you little – a product can sit at a good rank today only because it sold once an hour ago.
That is why BSR history is one of the most important metrics for Amazon sellers. With ProductPanel you see the rank for the last 7 days, 1 month, 3 months, 6 months or 12 months, and you can read actual sales from the shape of the line.
How to read a BSR history chart
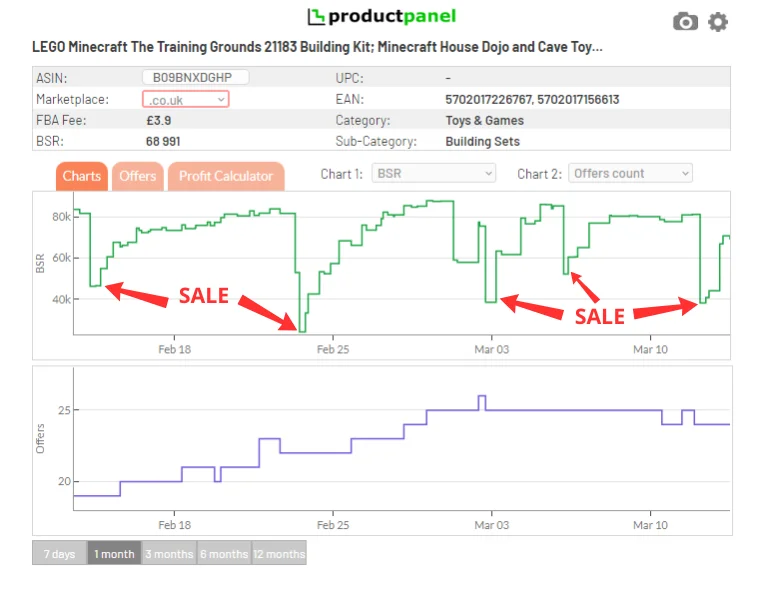
A product’s BSR drops with each sale and then slowly rises again while nothing sells. Frequent sharp drops in the chart mean strong sales; count them to estimate monthly sales volume. Long flat climbs mean the product isn’t selling.
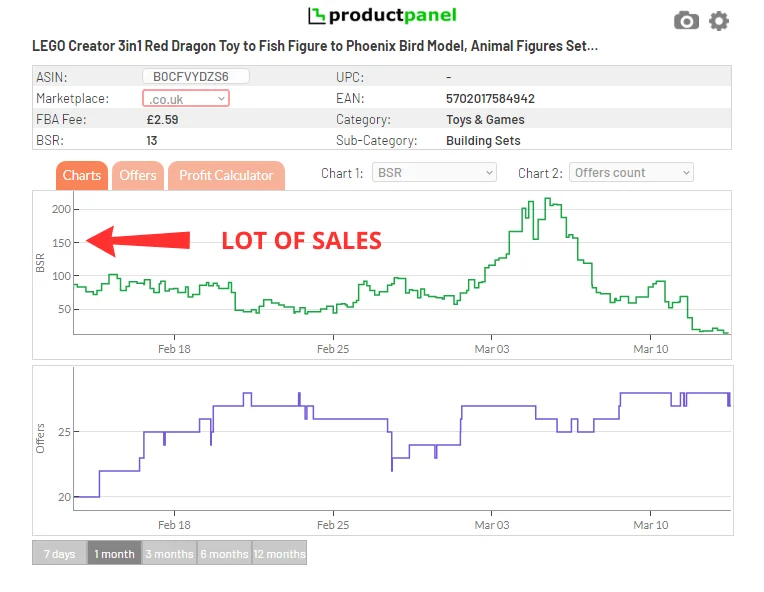
A product with very high sales volume looks different: the drops are no longer distinguishable and the chart shows a low BSR range as a smoothly undulating line.
Offers history chart
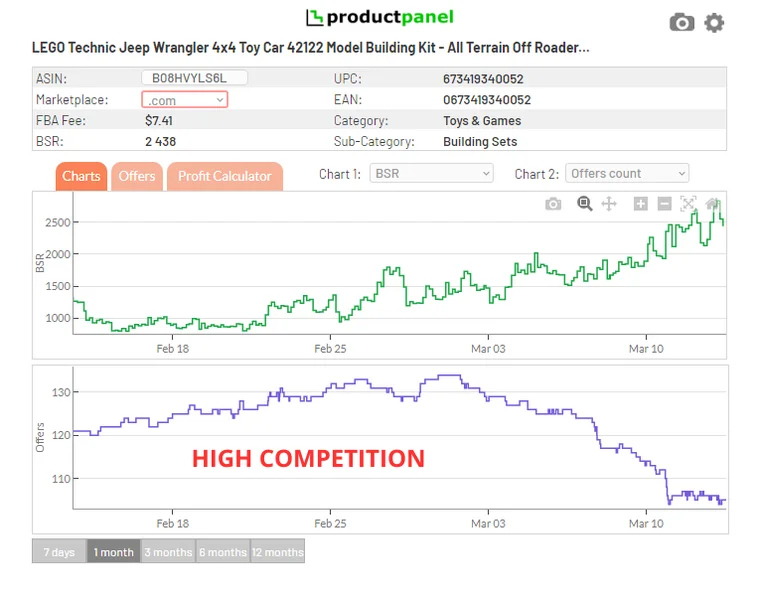
The offers chart shows how many sellers offered the product in new condition over time. It tells you how competitive the listing is – a rising number of offers usually means falling prices and a smaller share of the Buy Box. If you sell a private label product, it also shows whether another seller has jumped on your listing.
Price and Buy Box history
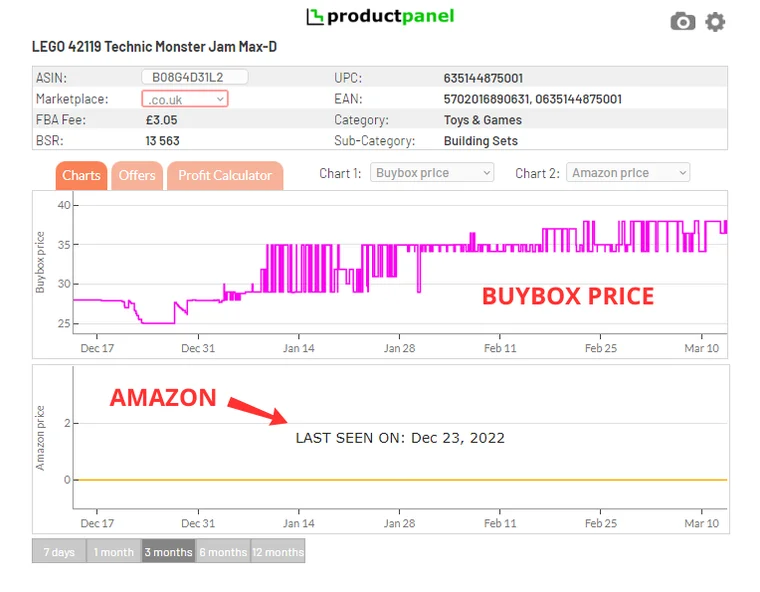
Track the history of every important price point on the listing:
- Buy Box price – the price most customers actually pay.
- Amazon price – when Amazon itself sells the product.
- Lowest FBA price and lowest FBM price.
If Amazon is not currently selling the product, ProductPanel shows the last date Amazon was a seller. Products Amazon has stopped selling are often the best opportunities for resellers.
Reviews history
The reviews chart shows how quickly reviews accumulate on a listing. A steady stream of new reviews is another sign of consistent sales, and it helps private label sellers estimate how long it takes to catch up with a competitor.
Works for books and KDP
ProductPanel works on any Amazon product page with a Best Sellers Rank – including books – so KDP authors and book resellers can use the same BSR history to check how a title sells.
How to check the BSR history of an Amazon product
- Install ProductPanel. Add the free ProductPanel extension to Google Chrome from the Chrome Web Store.
- Open an Amazon product page. Go to any product on amazon.com, amazon.co.uk, amazon.de, amazon.fr or another supported marketplace.
- Open the Charts tab. In the ProductPanel box on the page, select Charts. Chart 1 shows BSR by default.
- Pick the time range. Switch between 7 days, 1 month, 3 months, 6 months and 12 months.
- Compare with a second chart. Use Chart 2 to show offers count, Buy Box, Amazon, FBA or FBM price, or reviews under the BSR chart.
Video: quick guide to the extension
See BSR history in a real sourcing decision
In our online arbitrage case study, the BSR, offers and Buy Box history helped find a retired Lego set with a 21% ROI. Then use the live offers stock count to check competitors and the FBA storage fee calculator to plan costs.
Amazon BSR history – FAQ
What is Amazon BSR?
Best Sellers Rank (BSR) is a number Amazon assigns to a product based on its recent sales compared with other products in the same category. Rank #1 is the best-selling product in that category. A lower BSR means more sales.
How do I check the BSR history of an Amazon product?
Install the ProductPanel Chrome extension, open any Amazon product page and select the Charts tab. You will see the BSR history chart for up to 12 months, together with a second chart of your choice (offers, prices or reviews).
How do you estimate sales from a BSR chart?
Every time a product sells, its BSR drops (improves) and then slowly climbs back as time passes without a sale. Count the sharp drops in the chart to estimate the number of sales. Products that sell many times a day show a smooth, consistently low line instead of individual drops.
What is a good BSR on Amazon?
It depends on the category size. A BSR of 50,000 can mean several sales a day in a large category like Toys & Games, but very few sales in a small category. That is why the BSR history is more useful than a single current number: it shows how often the product actually sells.
Does ProductPanel show BSR history for books (KDP)?
Yes. ProductPanel works on any Amazon product page with a Best Sellers Rank, including books, so KDP authors and book sellers can check sales history as well.
Is the BSR history chart free?
The free plan shows the current BSR. The 12-month BSR, offers, price and review history charts are part of Premium ($9.97 per month with a 7-day free trial).